Distributional Parameters
Posted by Mischa Fisher
in
Econometrics
Wed 01 March 2017
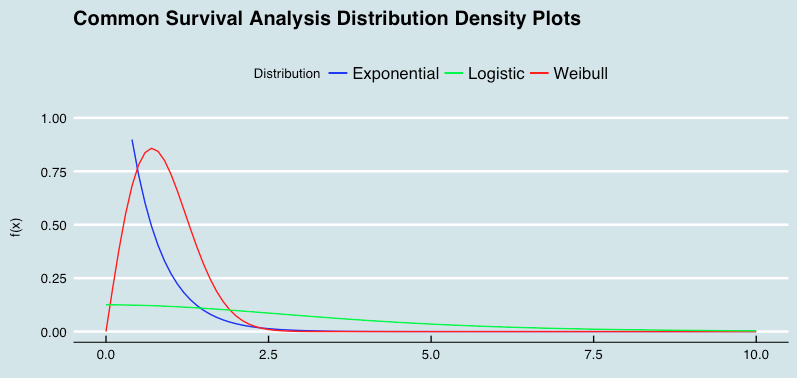
Part of my thesis involved modeling survival times against parametric distributions, such as the Weibull, log-logistic, and exponential distributions.
One of the fun aspects of distribution theory is seeing how different parameter specifications can make some distributions special forms of other distributions. For today's quick chart, a lead in to the subject by looking at how a couple of commonly used survival analysis parameters resemble one another (with the parameter specifications highlighted in the R code below).
x_lower <- 0
x_upper <- 10
max_height2 <- max(dexp(x_lower:x_upper, rate = 1, log = FALSE),
       dweibull(x_lower:x_upper, shape = 1, log = FALSE),
       dlogis(x_lower:x_upper, scale = 1, log = FALSE))
ggplot(data.frame(x = c(x_lower, x_upper)), aes(x = x)) + xlim(x_lower, x_upper) +
 ylim(0, max_height2) +
 stat_function(fun = dexp, args = list(rate = 2), aes(colour = "Exponential")) +
 stat_function(fun = dweibull, args = list(shape = 2), aes(colour = "Weibull")) +
 stat_function(fun = dlogis, args = list(scale = 2), aes(colour = "Logistic")) +
 scale_color_manual("Distribution", values = c("blue", "green", "red")) +
labs(x = "\n x", y = "f(x) \n",
title = "Common Survival Analysis Distribution Density Plots \n") +
theme(plot.title = element_text(hjust = 0.5),
axis.title.x = element_text(face="bold", colour="blue", size = 12),
axis.title.y = element_text(face="bold", colour="blue", size = 12),
legend.title = element_text(face="bold", size = 10),
legend.position = "top") + theme_economist()
Comments