State Budgets and Populations (a.k.a Why Illinois is in the shape it's in)
Given Illinois' current budget impasse, I thought it would be interesting to do a five minute analysis looking at how the size of each state's budget varies in proportion to its population. This is obviously a very shallow examination, and one could spends weeks digging through budget numbers, federal transfers, rural-urban splits, poverty and education levels, industry compositions, unfunded pension liabilities, worker's compensation costs, etc. etc. Still, summary statistics exist for a reason; and 5 minute analyses can be useful exercises.
Pulling data from Wikipedia's maintained list of US State budgets (here), and from the U.S. Census' estimate of 2015 state populations (here)
All States
First, a look at all U.S. States:

I knew Illinois' budget has historically been unsustainable, but, I was surprised at just how much of an outlier the state is. Mercatus now has Illinois rated dead last in the country in terms of fiscal solvency (link here), and with this chart, one can see why!
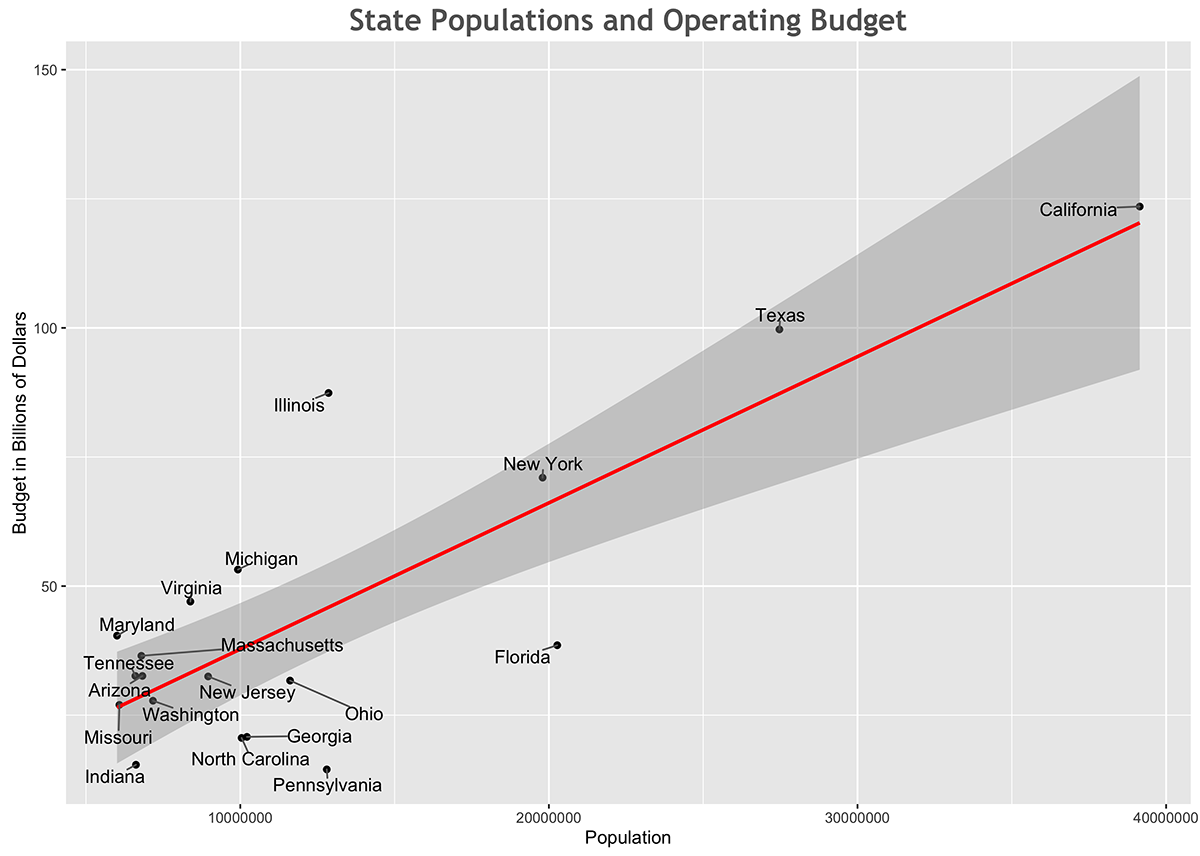
Just the Large States
Comparing large states to large states, here are all the states with populations above 6 million people.
Just the Small States
And in the same spirit, the small states:

Here it's worth noting that Illinois does not have the largest per capita budget; that honor goes to Alaska. Illinois simply is the largest deviator from the overall trend line in absolute dollar terms. That being said, since State budgets include federal transfer dollars for federal programs (infrastructure, heating assistance, etc. etc.), it's not hard to see why Alaska, which has very few people in it but a lot of federally supported infrastructure, is the highest per capita budget state.
UPDATE:
What was intended as a five minute "hey that's interesting!" analysis ended up exploding on the internet. With over 100K page views in 12 hours, the response was certainly unexpected. On that note, a few people on Reddit mentioned they'd be interested in seeing the log of the data. So here it is:

More importantly, I think it's important for people to remember that Wikipedia data is not always particularly accurate, nor is it necessarily an apples to apples comparison. Some of the data listed on the page is for single year periods, other bits of data are for multi-year periods. The script I used to plot takes those things into consideration, but, it may have errors given the inconsistency in Wikipedia's data. Time allowing I'll source better data and replot at some point in the future.
UPDATE 2:
NASBO has a dataset on state spending, I took some time to manually write down the state and spending columns as vectors in R (so there may be transcription errors) and the log of the data produces a result very different than Wikipedia's data:

So the story of Illinois' terrible fiscal condition could very well be more complicated than can be captured in a single graph. As in most things in life; the issue is complex and nuanced.
I will add though, the NASBO graph doesn't …